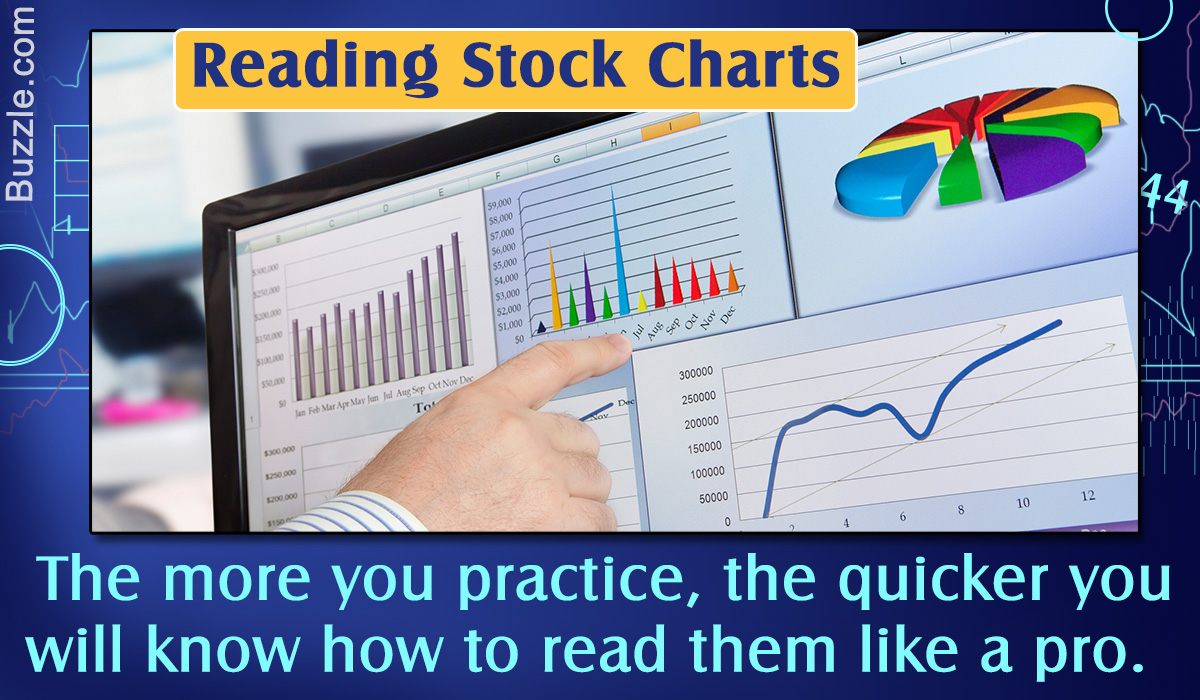
In order to excel in the stock market, the first thing you need to know is how to read stock charts and that’s exactly what this post is all about…
Trading stocks in the stock market is not easy, as it requires you to be aware of many things, including the latest market trends. Investing in the stock market can cause you to lose substantial amounts of money if you are not clear about the basics on how to proceed and where to put your money in.
Stock charts are nothing but analysis of stock trends over a certain period of time. Their purpose is to tell you the pattern followed by a particular stock; whether it has gone up, down or, for that matter, sideways. The basic assumption for reading the charts is that a stock is most likely to follow similar patterns in future as it had done in the recent past. Looking at it, you can conclude that if a stock has followed an upward trend for quite sometime, then it would possibly maintain a similar trend in the immediate future. This means investing in such a stock would be safe and would possibly fetch huge returns. Sounds interesting, isn’t it? And also quite helpful! But to extract all this valuable information, you must know how to read a stock chart, which is one of the many ways to predict the stock market.
If you are wondering how difficult it is to read one, worry not. The entire process of mastering the art of reading stock charts, isn’t as difficult as it seems. All you need is basic knowledge of what to look for, and where to look for it, along with practice, practice and more practice! Before we begin with the method of reading one, let’s have a look at the different types of stock charts.
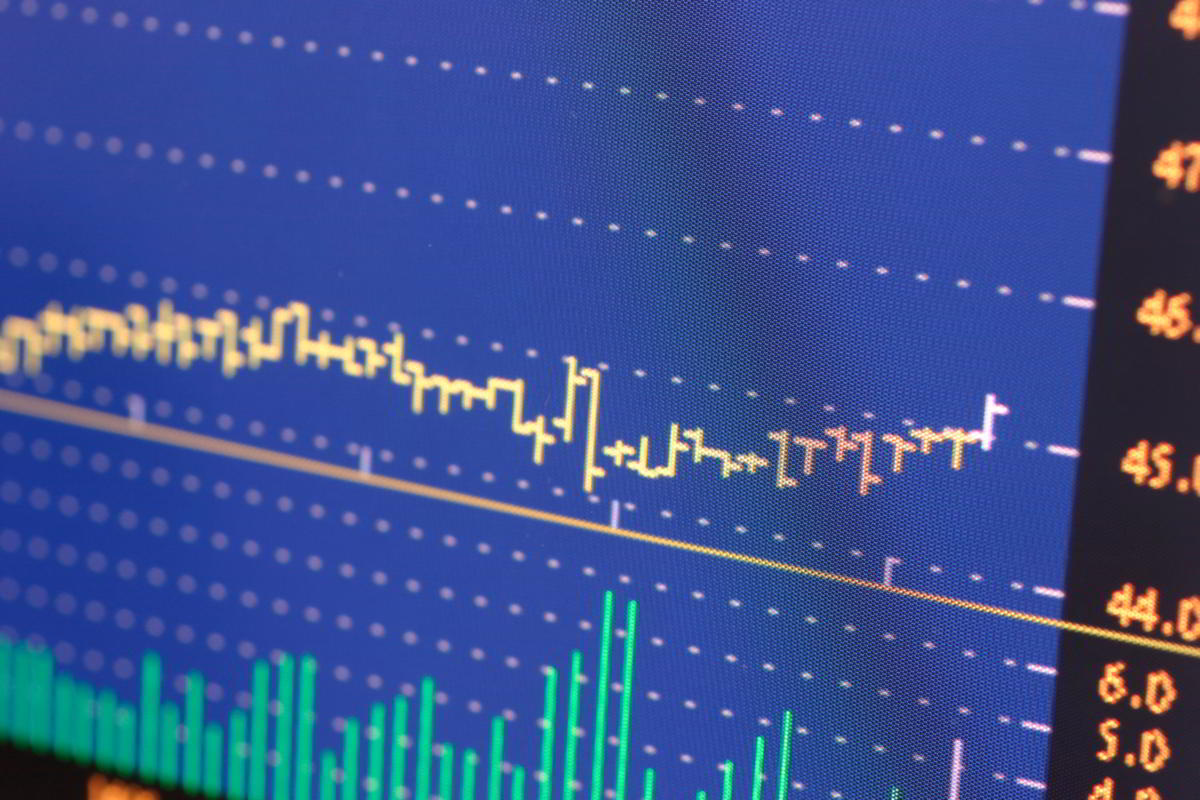
There are basically three types of stock charts: line charts, bar charts and candlestick charts. Line charts and bar charts are not very effective in predicting the stock trends and hence, are not so reliable. It is not possible to extract all the necessary information from these charts. The most popular type is the candlestick chart, also referred to as the Japanese candlestick chart. The reason for its popularity is that it makes it simple for traders to find the required information. However, the basic method to analyze and interpret a stock chart is the same, irrespective of its type.
How to Analyze Stock Charts
You must understand that in order to be able to read stock charts quickly, like the trade pundits do, you need to have a good deal of experience analyzing stock trends. As for beginners, all one needs to do is understand the basics, and practice by trying to read the information from stock charts of different companies. The more you practice, the quicker you will know how to read them like a pro! Here we’ll discuss the method of reading these charts by analyzing the elements that you need to look for. There are many elements in a standard stock chart that enable you to interpret the information contained in it. These elements are termed as the indicators. The most basic indicators are enlisted below, along with their significance.
Trends

The first thing that you need to look for while trying to read a stock chart, is the trend. The trend can be upwards, downwards or sideways. If the trend is upwards, it signifies a rise in the price of the stocks of the particular company. A consistent upward trend in the stocks, along with other factors, can be safely assumed to be a good indicator of the fact that a prospective investor stands to gain from the stocks of the company. This is in accordance with the principle of technical analysis, which states that stock prices mostly have a tendency to follow similar patterns in the future as they did in the past.
Level of Resistance and Level of Support
If you observe a stock chart closely, you’ll find that there are certain price levels at which the graph seems to have got stuck, and has remained consistently at these price levels for a pretty long time, unable to move up or down. These points are significant for the overall analysis of the stock chart, because these show the ability of the stocks of a company to overcome situations of crisis. The level of resistance is the price level that the stock is unable to break through, or has done so with much difficulty. Similarly, the level of support is the price level below which the stock price seldom falls. If you observe that the stock price has overcome the level of resistance in more instances than one, then it can be concluded that the stocks of the company have the potential to recover from crisis, and it is safe to invest in such stocks.
Volume
At the bottom of the stock chart, you’ll find a bar graph that represents the number of people who purchased stocks of the company over a period of time. If you find that more people were interested in the stocks when the prices were up, then it is a healthy trend. In stock market terminology, this is referred to as bullish (bull signifies an investor who thinks that the market will witness further growth). However, if the number of interested people decrease with the increase in the price of stocks, then the trend is termed as bearish (bear signifies an investor who thinks that the market will witness decline). It is not advisable to invest in stocks that exhibit bearish trends.
Chart Patterns
In addition to studying the trends given above, you should also try to find any particular patterns on the chart. There are a set of pre-defined chart patterns that you need to look out for, which can either be continuation patterns or reversal patterns. Some of the common patterns found on stock charts are given below, along with their meanings.

Bullish Rectangle: The graph shows a continuous upward trend and indicates that the uptrend would continue.
Wolf Wave: This graph is in the form of a wave and the price of the stock oscillates between the levels of support and resistance.

Bear Flag: Indicates that the prices of stock will continue to go down.
Flat Base: Indicates that the stock prices have remained stable for a substantial period of time.
Double Top: The stock, having made two attempts to break through the resistance level, goes below the support level. It is a reversal pattern.
In addition to these, there are several other chart patterns and each one of them indicates a particular trend of the stocks.
This was precisely about reading stock charts. Once you start making attempts to read them, you will soon learn the intricacies of this art. So, the next time you come across a stock chart, don’t let it baffle you. Instead, try interpreting it using the points discussed above.